


2Department of Physics, Rabindranath Tagore University, Bhopal-India
3Department of Radiotherapy, Chirayu Medical College and Hospital, Bhopal-India
4Department of Radiotherapy, Gandhi Medical College, Bhopal-India DOI : 10.5505/tjo.2022.3659
Summary
OBJECTIVEThe study was conducted to compare the dosimetric superiority between the three-dimensional conformal radiation therapy (3DCRT), intensity-modulated radiation therapy (IMRT) and Rapid Arc in terms of treatment plan quality.
METHODS
We have taken 15 Patients of ca-esophagus for our study from our hospital database. Patients were already
treated 3DCRT plan. Retrospectively additional IMRT and RA plans were created with Planning
target volume (PTV) prescription dose of 50.4Gy in 28 fractions. Prescription dose of 95% of PTV was
chosen for the comparison between three treatment planning strategies. Dose volume histogram was
used to analyze and compare various plan quality index and doses to the organs at risk (OARs).
RESULTS
The D95% of PTV for 3DCRT plan was 47.85±0.78 Gy, which significantly got improved in IMRT
(48.75±0.86 Gy) and RA (49.0±0.64 Gy) plans. The CI value for PTV coverage in 3DCRT was 0.96±0.04;
however, the CI values in IMRT and RA plans were significant at 0.98±0.01 and 0.98±0.03, respectively.
The 3DCRT plan had an HI of 1.09±0.03, which was significantly raised to 1.046±0.26 in the IMRT plan
(p=0.01) and 1.06±0.02 in the RA plan (p=0.03).
CONCLUSION
An IMRT and RA plan gives greater conformity of dose to the PTV in comparison to 3DCRT. Lesser
doses to the surrounding OARs are the major importance of the IMRT and RA planning technique.
Dose escalation is possible with IMRT and RA plans.
Introduction
Esophageal carcinoma (EC) is one of the most aggressive types of malignant tumors worldwide. An epidemiology and end data analysis on the EC report indicates that overall survival is around 18.8% after 5 years, and 15690 individuals died as a result of cancer, accounting for 2.6% of all cancer deaths.[1] EC has poor functional outcomes and causes problems for surgeons and radiation oncologists. Surgery is the primary treatment option for EC patients who are operable and medically fit. Concurrent chemo-radiotherapy, on the other hand, plays an essential role in the management of advanced EC patients who are medically unsuitable for surgery and generates optimum therapeutic results.[2]However surrounding organs at risk (OARs) often limits the tumor dose. Planning target volume (PTV) is surrounded by lung, heart, and sometimes abutting to spinal cord. Studies have concluded that the use of modern radiation therapy (RT) techniques is helpful to explore the possibility of dose escalation.
Advances in RT technology have shifted for EC treatment techniques from three-dimensional conformal RT (3DCRT) to intensity-modulated RT (IMRT) and volumetric modulated arc therapy (VMAT) to allow for the sparing of normal healthy organs such as the lungs, heart, stomach, liver, kidneys, and spinal cord. IMRT treatment plan shows superiority to 3DCRT treatment plan based on dose volume analysis.[3-4] In contrast to the 3DCRT, IMRT provides more conformal dose to the target as well as higher dose gradients to surrounding tissues, which may ensure better local tumor control. [5] Nevertheless IMRT has major drawbacks of higher treatment delivery time and increased monitor units (MU), as a consequence patient will spend more time on the treatment table. Also, higher MU in IMRT will give higher irradiation to a small volume of healthy tissues and nearby OARs which increases the probability of secondary cancer risk.[6] Rapid Arc is analogs terms to VMAT, technique specified by Varian Medical system.
RA produces dose distribution similar to that of IMRT using a single or multiple arc rotation of the gantry. Recent research indicated that VMAT is superior to traditional IMRT in terms of PTV conformity and dose reduction in OARs.[7,8]
The current study's goal is to determine the potential comparative clinical benefit of the 3DCRT, IMRT, and RA treatment techniques used in the treatment of EC, to determine the dosimetrically appropriate technique in terms of dose to PTV and minimum dose to OARs, and to determine whether dose escalation is possible with higher techniques.
Methods
In this study, 15 patients with esophageal cancer were chosen at random from our department"s data bank. All of the patients were previously treated with 3DCRT on a Varian Vital Beam Linear accelerator (LA) machine (M/S Varian Medical Systems, Palo Alto, CA, USA). All patients were immobilized in a supine position, with one arm over the head and the other in a neutral position. CT simulation was obtained using standard procedures on a Positron Emitted Tomography (PET)/ Computed Tomography (CT) (Discovery IQ, GE Healthcare) scanner with 2.5 mm slices spacing.After acquiring the CT images of the patients" gross tumor volume (GTV) and other associated target volume (TV) were contoured according to the RT Oncology Group (RTOG) 0436 protocol by the Radiation Oncologist.[3] A GTV was defined by a physician using a PET fusion imaging, and it includes the gross esophageal tumor as well as positive regional lymph nodes. In comparison to the GTV, the clinical TV (CTV) had a superior-inferior margins of 3-5 cm and lateral as well as anterior-posterior margins of 1 cm. The PTV was separated from the CTV by a 1 cm margin. PTV margins were differed from case to case and sometimes lesser posterior margins are given to avoid overlapping with spinal cord. The heart, lungs, spinal cord, stomach, and kidneys were contoured as OARs.
Dose Prescription and Treatment Objective
Each patient was scheduled to receive 1.8 Gy in 28
fractions for a total dose of 50.4 Gy. The planning goal
was to deliver 95% of the prescribed dosage (PD) to
95% of the PTV volume, with no more than 2% of the
PTV volume getting 107% of the PD and a maximum
dose of <110% of the PD. The major aims of the OARs
were defined as: Spinal cord Dmax<45 Gy; and lungV20Gy
<37% and V30Gy <25%. The secondary objectives were
as: Mean dose of lungs <20 Gy; heart V40Gy 50%; and
mean dose of heart <30 Gy.
Radiotherapy Planning
The LA used to deliver treatment planning was Varian
Vital Beam equipped with the Millennium 120 multileaf
collimator (MLC). Photon beam of energies 6MV,
10MV, and 15MV was used in this study for all cases
treatment planning. There are total 60 pairs of leaves
with 40 leaf pairs in the center and ten pairs on either
side. The projection of center leaf width at isocenter
was 5 mm while the outer leaves were 10 mm. The
maximum travelling speed of MLC was 2.5 cm/s. The
treatment planning system used for the external beam
planning was Eclipse (Version 13.6.23, Varian Medical
System) and final dose calculation was performed
by Anisotropic Analytical Algorithm (AAA, version
13.6.23).Retrospectively new additional IMRT and RA plan were created for each patient. Inverse optimization
was performed by Photon Optimizer (PO) utilized
for both IMRT and RA optimization (version 13.6.23).
Different treatment planning strategies were involved in the treatment of the esophageal cancer patient.
3D-CRT Planning
3DCRT plans were scheduled to perform into two
phases of treatment, with each phase planned separately
for the same PTV. Phase-I consisted of a giving 36 Gy
dose to PTV with Parallel-opposed, anterior-posterior
(AP), and posterior-anterior (PA) 6 MV, 10MV, and
15MV photon beam, followed by remaining dose of
14.4 Gy in Phase-II, with three photon field. Beam energy
selection was based on patient thickness and PTV
coverage. A beam angle for phase-II planning includes
an AP field and 2 posterior oblique fields at gantry angles
between 100-120° and 240-260° chosen in such a
way to avoid the spinal cord. Appropriate wedge angles
were used in posterior oblique beams to achieve optimum
PTV dose distribution.
IMRT Planning
This treatment planning strategy involved treating
the PTV with total 54 Gy in 1.8 Gy into 30 fractions.
Inverse optimization was performed with PO which
helps in computing optimal fluence maps from dosevolume
constraints derived from the general planning
objective. Varian leaf motion calculator was used
to calculate actual fluence which is then delivered by
MLCs to deposit the planned dose. Final dose calculation
was performed by AAA algorithm.
RA Planning
The RA is unique treatment technique that allows the
radiation to be delivered to the patient in a single 360°
of gantry rotation that is accurately and efficiently with
varying velocities and positions of the MLCs, dose rate,
and gantry speed. This leads RA being an intensity-modulated
dose distribution. The RA dose optimization is an
aperture-based method, which incorporates MLCs leaf
positions and MU weights as optimization parameters.
The entire gantry rotation is described in the optimization
process by a sequence of 177 control points. The optimization
is based on the PO algorithm and the process
is divided into five discrete multi resolution levels (MRs).
The PO needed less control points to approach the convergent
solution. The dose distribution is calculated during
optimization with a MR dose calculation algorithm.
In this study,RA plan with two full arcs and with single isocenter was generated Arc consists of a clockwise and a counter-clockwise arc from gantry angles 181.0-179.0 and 179.0-181.0, respectively with collimator rotation of 15-20°. Collimator rotation was given to cover the entire tumor and minimize tongue and groove effect of MLCs during arc rotation.
Plan Evaluation and Statistical Methods
As per International Commission on Radiological
Units and Measurements (ICRU Report 83, 2010)[9]
doses to the TV, Conformity Index (CI), Homogeneity
Index (HI), and OARs were recorded from their respective
cumulative-dose volume histogram (cDVHs).
HI
HIwas evaluated as the difference between the dose to
2% (D2) and 98% (D98) of PTV divided by dose to 50%
HI=(D2%-D98%) ? D50% (1)
Where D2%, D98%, and D50% are the minimum dose
delivered to 2%, 98%, and 50% volume of the TV, respectively.
HI of zero indicated homogeneous dose distribution.
CI
A ratio evaluating the coverage of the prescription dose
in treatment plans.
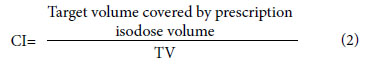
The value of CI to 1 indicates the good dose conformity. In addition, treatment parameters including the MU and beam on time (BOT) for each treatment plan were recorded for evaluation. BOT was defined as the radiation delivery time and did not incorporate gantry movement, the patient positioning and imaging procedures, which was noted while performing quality assurance.
For the evaluation of target conformation .The Conformation number (CN)[10] is defined as
CN=[TVRI/TV]*[TVRI/VRI] (3)
TV, TVRI, and VRI represent the treatment volume, the treatment volume at reference isodose (RI) of the prescribed dose, and the total volume at RI of the prescribed dose, respectively. The RI was defined as 95% of PTV prescribed dose. The maximum value for CN is 1, corresponding to perfect PTV coverage.
To asses overall plan quality of the treatment plans another parameter named quality factor (QF) was calculated.[11] Which consist of all measured planning index such as CI, HI, and CN. The QF for the treatment plan can be calculated in terms of combination of above set of planning indices expressed as below.
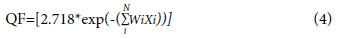
Where the values of the weight factor (Wi) can be modified between zero and unity for all relatively weighted indices Xi for a user-defined number of indices (N) in the UPI set. Here, in our case, we have set all the weight factor to 1.
A test of significance was required to quantify the differences between observed parameters of 3DCRT, IMRT and RA plans. The one-way analysis of variancewas used to compare dosimetric and volumetric indices among different plans, and when an overall significant difference among the groups was observed, the post hoc Turkey's test was used to determine which pair-wise comparisons differed. All statistical tests were done using the IBM Statistical Package for the Social Sciences (SPSS) software (release 20.0, SPSS Inc., Chicago, IL, USA). Statistical significance was defined as p<0.05.
Results
Table 1 shows the patients characteristics and demographics. Out of 15 patients selected 12 were male and rest 3 were female. Patients" ages ranged from 35 to 85 years. PTV volume ranges from 268.3 to 728.7 cc with an average volume of 408.75±116.24 cc.;)
Dmax dose to TV was substantially greater in the 3DCRT (54.03±0.556 Gy) plan than in the IMRT (52.46±1.031 Gy) and RA (53.2±0.41 Gy) plans, with p values of (p=0.01) and (p=0.046), respectively. There was no significant difference in Dmax dosage between IMRT and RA plans (p=0.069) (Table 2).
;)
Table 1: Patient characteristics tumor volume and tumor staging
Table 2: PTV dosimetric and treatment plan quality parameters
With 50.59±0.24 Gy, 50.59± 0.04 Gy, and 50.06±0.24 Gy, respectively, the mean dose to PTV in 3DCRT and RA plans was higher than in IMRT plans. The D95% of PTV coverage in the 3DCRT plan was 47.85±0.78 Gy, which was significantly better than the IMRT and RA plans, which were 48.75±0.86 Gy and 49.0±0.64 Gy, respectively (Fig. 1). In the 3DCRT plan, the V95% of PTV volume was 384.95±121.45 cc, whereas in the IMRT and RA plans, it was 397.58±133.81 cc and 400.34±130.89 cc, respectively (Fig. 2).
;)
;)
The CN value for 3DCRT was reported to be 0.56±0.1, which improved significantly to 0.74±0.12 in IMRT (p=0.001) and 0.81±0.05 in RA (p=0.001), respectively. It was found that in 3DCRT, the CI value for PTV coverage was 0.96±0.04, whereas in contrast to IMRT and RA plans, the CI values were significant at 0.98±0.01 and 0.98±0.03. The HI of the TV was 1.09±0.03 in the 3DCRT plan, which was substantially enhanced to 1.046±0.26 in the IMRT plan (p=0.01) and to 1.06±0.02 in the RA plan (p=0.03).
Table 3 shows the dose volume statistics for OARs. The highest dosage to the spinal cord in the 3DCRT plan was 45.23±4.0 Gy, but in the IMRT and RA plans, the maximum dose to the spinal cord was significantly lowered to 38.84±4.34 Gy (p=0.007) and 34.80±4.02 Gy (p=0.002), respectively. The average dosage to the combined lungs was shown to be lower in 3DCRT, with an average dose of 15.46±3.36 Gy, compared to 16±2.96 Gy and 17.79±2.66 Gy in IMRT and RA plans, respectively. The V20Gy volumetric dose parameter of the ipsilateral lung in 3DCRT was 26.69±8.56 Gy, while it was 34.6±7.35 Gy and 30.39±9.99 Gy in the IMRT and RA plans, respectively.
;)
Table 3: Shows the results of average OARs DVH characteristics
The average heart dosage in 3DCRT was 32.32±9.16 Gy, but the average heart dose in IMRT and the RA plan was 25.08±4.8Gy (p=0.06) and 22.99±6.13 Gy (p=0.015), respectively, with significantly lower radiation dose. The heart's V25Gy was 67.74±23.31 Gy in 3DCRT, but this reduced to 42.83±10.87 Gy (p=0.017) and 34.71±14.97 Gy (p=0.001) in the IMRT and RA plans, respectively. Heart's V30Gy dose in the 3DCRT plan exceeded our clinical dose requirements by a wide margin, but the dose was considerably reduced in the IMRT (p=0.02) and RA (p=0) plans. In 3DCRT, the heart"s V30Gy was 61.5227.06 Gy, whereas it was only 31.697.04 Gy (p=0.002) and 24.2910.43 y (p=0.001) in the IMRT and RA plans, respectively.
In the 3DCRT plan, the average MU required to deliver a dose of 50.4 Gy was reported to be the lowest (218.72±7.9). While the average MU required to give the same dose in IMRT and RA plans was 698.80±179.0 (p=0.001) and 510.98±86.27 (p=0.001), respectively. BOT was found to be less (0.43±0.14 min) in 3DCRT, which increases to 1.16±0.29 min and 0.85±0.14 min in IMRT and RA plans, respectively (Table 4).
;)
Table 4: The average MU and BOT in 3DCRT, IMRT, and RA treatment plans
Discussion
Squamous cell carcinomas are more common in Asian countries as compared to adenocarcinomas in western countries. RTOG94-05 demonstrated survival benefits with dose escalation but conventional 2D technique was used by the investigators and thus the study was limited by higher dose to surrounding OARs.[2] Local failures and residual disease continue to be the main therapeutic concerns in EC; therefore, this study was designed to investigate the possibility of dose escalation utilizing modern methods IMRT and RA in EC, as well as to assess dosimetric comparison between 3DCRT, IMRT, and RA planning techniques. The cDVH was used to compare and assess all treatment regimens.In this study, the dosimetric characteristics of IMRT and RA plans in the treatment of patients with middle one-third esophageal cancers were studied by comparing them to 3DCRT plans. IMRT and RA plans showed the increased dose conformity homogeneity and PTV coverage when compared to 3DCRT (Fig. 3). Fenkell et al., Nutting et al. and Allehyaniet al.[12-14] found similar results to ours in his study of comparisons of 3D-CRT versusIMRT for esophageal cancer. The normal value of QF is also unity, with values above unity referred to as overdosed and values below unity referred to as under dose of the structures contoured volume in the corresponding plan.
;)
In RA and IMRT plans, the QF is higher than in
3DCRT. This could be due to better CI, HI, and CN
values reported in IMRT and RA plans. IMRT and RA
plans have the ability to cover the PTV with prescribed
dose and simultaneously they deliver high dose gradient
outside the PTV. This results in high conformity
to the PTV.IMRT and RA plans reduced the amount
of normal tissues irradiated with a high dosage while
increasing the volume of normal tissues treated with
a low dose. The study of Vivekanandan et al.[8] also
concluded that the IMRT and RA gives superior target
dose conformity compared to 3DCRT for EC. For
centrally located carcinoma of the anal canal, prostate,
cervical, and head and neck cancer, RA can produce
dosimetry similar to that of IMRT. As a result, Zhang et
al.[15] compared RA to IMRT in EC and found similar
PTV coverage (p=0.26) and V10 lung (p=0.1650) with
the lower spinal cord Dmax (p=0.0389), heart mean dose
(p=0.0002), and V20 lung (0.009) While IMRT was superior in terms of lung V5 and mean dosage, conventional
RT prevailed out. Accordingly, they found that
RA has varied advantages and disadvantages in treating
the mid/lower esophageal but improved PTV coverage
in treating the upper EC patients as PTV is T-shaped
across chest with a considerable reduction in MUs.
Similar results were observed in our studies where we
have seen that V95% of PTV jumps to 3.36% and 4.10%
in IMRT and RA plan compared to 3DCRT plan. With
the effect of this our CI value also got increased in the
following order 3DCRT
Pulmonary toxicity is a major potential adverse
effect of treatment for esophageal cancer. As a result,
the dose constraint to bilateral lung is the most important
factor to consider when evaluating treatment
regimens. Numerous studies had been published having
contradicting parameters for predicting pulmonary
toxicity,[14,15] but it was still difficult to compare
them. The V10Gy, V20Gy, and V30Gy were utilized in this
investigation to assess lung toxicity. Mary et al.[16] remarked that when the total lung V20Gy reaches 25%,
there is a very little chance of pneumonitis. Asakura
et al.[17] reported that V20Gy of >37% is a risk factor
for radiation pneumonitis in RT for esophageal cancer.
Moreover, Dmean in the lungs was reported to be correlated
with pneumonitis, with Dmean levels of 20-23Gy
recommended.[18] In our work, we are successfully
able to keep the V20Gy below 37% (3DCRT
Numerous studies have found significant radiationinduced
heart damage when the heart received more
over 40Gy, and that lowering V40Gy was important in reducing
heart toxicities. Pao et al.[18] found that V30 of
more than 33% and Dmean of more than 20Gy strongly
linked with all grades of cardiac effusion in IMRT for
esophageal cancer. In their investigation, V30Gy of more
than 65% and V40Gy of more than 55% was important
predictor of grade 3 or higher cardiac effusion. According
to Wei et al.,[20] V30Gy of 46% and Dmean of <26Gy
were connected to the retention of cardiac effusion after
chemo- RT for esophageal cancer. In our work except
3DCRT we are able to achieve the V30Gy <46% in IMRT
and RA plan. In comparison to 3DCRT, IMRT, and RA
plans reduced V30Gy by 49% and 60%, respectively. Furthermore,
3DCRT plans are unable to meet the target of
heart mean dose of <26Gy. While, IMRT and RA plans
were able justify the heart mean dose tolerance.
The spinal cord is a dose-restricted organ in the
case of EC, and it should be kept out of the field of
radiation when the neck, thorax, abdomen, and pelvis
are all being treated. Kirkpatrick et al.[21] reported
that a conventional fraction dose of 2Gy per day with
a total spinal cord dose of 50Gy, 60Gy, and 69Gy was
associated with a 0.2%, 6%, and 50% rate of myelopathy.
We kept maximum dose for spinal cord as 50Gy.
The highest dose to the spinal cord was well within
the maximum dose of 50Gy for the 3DCRT, IMRT,
and RA planning techniques. In our study, in comparison
to the 3DCRT plan, the maximum spinal cord
dose was reduced by 14.4% and 23.1% in the IMRT
and RA plans, respectively. With IMRT and RA, the
spinal cord received doses that were considerably below
its toxicity limit (Fig.ffigure5>5).
Scattered dose is directly related to MU number.
In comparison to IMRT and RA, 3DCRT plans
had the lowest MU in our study. When compared to
3DCRT, IMRT, and RA treatment plans utilize up to
3 times as many MUs (Fig. 6). The BOT is related to
the amount of MU delivered in fractions. Because
3DCRT plans have a lower MU, they have a lesser
BOT as compared to IMRT and RA plans. As a result,
patients spend less time inside the treatment room
and are more comfortable on treatment couch during
treatment delivery.
;)
;)
;)
Conclusion
According to the findings of this study, IMRT and RA provided improved PTV coverage in terms of CI, CN, HI, and lower OARs doses to the heart and spinal cord when compared to 3DCRT, but at the expense of increased average dosage and higher V5Gy, V10Gy dose to the lung. The normal MU ratio between the IMRT plan and the 3DCRT plan is 2-3. This adds to greater leakage radiation and, as a result, an increased dose to normal tissue and the entire body in general. As a result, IMRT and RA, in particular, can allow dose escalation in the treatment of EC as long as lung dose and low radiation to adjacent healthy tissues are successfully reduced.Peer-review: Externally peer-reviewed.
Conflict of Interest: All authors declared no conflict of interest.
Financial Support: None declared.
Authorship contributions: Concept - D.K.S., G.G., S.S., S.Y., N.P.; Design - D.K.S., S.S., S.Y.; Supervision - S.S., D.K.S., S.Y., N.P.; Funding - None; Materials - None; Data collection and/or processing - D.K.S., S.S., S.Y.; Data analysis and/or interpretation - D.K.S., S.S., S.Y., N.P.; Literature search - D.K.S, G.G., S.S., S.Y.; Writing - D.K.S., S.Y.; Critical review - D.K.S., G.G., S.S., S.Y., N.P.
References
1) National Cancer Institute Surveillance, Epidemiology,
and End Result Program. Cancer Stat Facts: esophageal
cancer (2017). Available at: https://seer.cancer.gov/
statfacts/html/esoph.html. Accessed Aug 22, 2022.
2) Minsky BD, Pajak TF, Ginsberg RJ. INT 0123 (Radiation
Therapy Oncology Group 94-05) phase III trial
of combined-modality therapy for esophageal cancer:
high-dose versus standard-dose radiation therapy. J
Clin Oncol 2002;20(5):1167-74
3) Ilson DH, Moughan J, Suntharalingam M, Dicker A,
Kachnic LA, Konski AA. RTOG 0436: A phase III trial
evaluating the addition of cetuximab to paclitaxel, cisplatin,
and radiation for patients with esophageal cancer
treated without surgery. J Clin Oncol 2014;32:15_
suppl:4007.
4) Palma D, Vollans E, James K, Nakano S. Volumetric
modulated arc therapy for delivery of prostate radiotherapy:
comparison with intensity-modulated radiotherapy
and three-dimensional conformal radiotherapy.
Int J Radiat Oncol Biol Phys 2008;72(4):996-1001.
5) Lin JC, Tsai JT, Chang CC. Comparing treatment plan
in all locations of esophageal cancer: volumetric modulated arc therapy versus intensity-modulated radiotherapy.
Medicine (Baltimore) 2015;94(17):e750.
6) Choi KH, Kim J, Lee SW. Dosimetric comparison
between modulated arc therapy and static intensity
modulated radiotherapy in thoracic esophageal cancer:
a single institutional experience. Radiat Oncol J
2018;36(1):63-70.
7) Wu Z, Xie C, Hu M. Dosimetric benefits of IMRT and
VMAT in the treatment of middle thoracic esophageal
cancer: is the conformal radiotherapy still an alternative
option? J Appl Clin Med Phys 2014;15(3):93-101.
8) Vivekanandan N, Sriram P, Kumar SA. Volumetric
modulated arc radiotherapy for esophageal cancer.
Med Dosim 2012;37(1):108-13.
9) Hodapp N. The ICRU Report 83: prescribing, recording
and reporting photon-beam intensity-modulated
radiation therapy (IMRT). Strahlenther Onkol
2012;188(1):97-9.
10) van't Riet A, Mak AC, Moerland MA, Elders LH, van
der Zee W. A conformation number to quantify the
degree of conformality in brachytherapy and external
beam irradiation: application to the prostate. Int J Radiat
Oncol Biol Phys 1997;37(3):731-6.
11) Pyakuryal A, Myint WK, Gopalakrishnan M, Jang S,
Logemann JA, Mittal BB. A computational tool for the
efficient analysis of dose-volume histograms from radiation
therapy treatment plans. J Appl Clin Med Phys
2010;11(1):3013.
12) Fenkell L, Kaminsky I, Breen S. Dosimetric comparison
of IMRT vs. 3D conformal radiotherapy in the
treatment of cancer of the cervical esophagus. Radiother
Oncol 2008;89(3):287-91.
13) Nutting C, Dearnaley DP, Webb S. Intensity modulated
radiation therapy: a clinical review. Br J Radiol
2000;73(869):459-69.
14) Allehyani SH, Sharyan HA, Tolba AR. 3DCRT versus
RapidArc in terms of iso-dose distribution, dose
volume histogram (DVH) and organs at risk for
esophageal cancer (EC) dosimetric study. AJECR
2017;5(4):123-33.
15) Zhang Y, Wang H, Huang X. Dosimetric comparison
of TomoDirect, helical tomotherapy, VMAT, and ff-
IMRT for upper thoracic esophageal carcinoma. Med
Dosim. 2019 Summer; 44(2):167-72.
16) Mary VG, Purdy JA, Emami B. Clinical dose-volume
histogram analysis for pneumonitis after 3D treatment
for non-small cell lung cancer (NSCLC). Int J Radiat
Oncol Biol Phys 1999;45(2):323-9.
17) Asakura H, Hashimoto T, Zenda S. Analysis of dosevolume
histogram parameters for radiation pneumonitis
after definitive concurrent chemo-radiotherapy for
esophageal cancer. Radiother Oncol 2010;95(2):240-4.
18) Pao TH, Chang WL, Chiang NJ, Lin CY, Lai WW,
Tseng YL, et al. Pericardial effusion after definitive
concurrent chemotherapy and intensity modulated
radiotherapy for esophageal cancer. Radiat Oncol
2020;15(1):48.
19) Jo IY, Kay CS, Kim JY. Significance of low-dose radiation
distribution in development of radiation pneumonitis
after helical-tomotherapy-based hypofractionated
radiotherapy for pulmonary metastases. J
Radiat Res 2014;55(1):105-12.